An analysis of the contents of PEDro in the 2 February 2026 update is presented on this page. These data will be updated annually, so the next update is planned for February 2027.
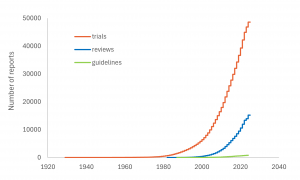
On 2 February 2026 PEDro contained 67,267 reports of randomised controlled trials, systematic reviews and evidence-based clinical practice guidelines. There were 50,120 trials, 16,304 reviews, and 843 guidelines. The graph below illustrates the cumulative number of trials, reviews and guidelines available each year.
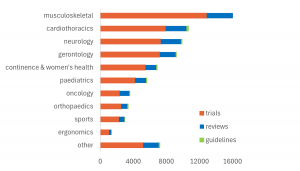
PEDro indexes reports of trials, reviews and guidelines for all areas of physiotherapy. The graph below illustrates the number of trials, reviews and guidelines available for each area of physiotherapy. Musculoskeletal and cardiothoracics had the largest quantity of trials, reviews and guidelines. Note that this graph is based on coding for 66,290 records with complete data (977 records are in-process, so have not been coded for area of physiotherapy yet). Each trial, review and guideline can be coded for more than one area of physiotherapy, so the total number of reports in this graph adds to more than 66,290.
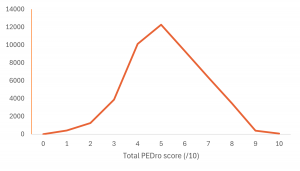
Trial reports indexed on PEDro are rated with a checklist called the “PEDro scale”. The PEDro scale was developed to help PEDro users rapidly identify trials that are likely to be internally valid and have sufficient statistical information to guide clinical decision-making. Each trial report is given a total PEDro score, which ranges from 0 to 10. The graph below illustrates the number of trial reports scoring each total PEDro score. The average total PEDro score is 5.2, with a standard deviation of 1.6. 42% of trial reports are of moderate to high quality, scoring ≥ 6/10 on the PEDro scale. Note that this graph is based on coding for 49,143 records with complete data (977 trial reports are in-process, so have not been rated using the PEDro scale yet).
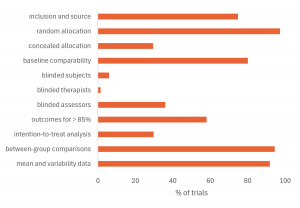
The graph below illustrates the percentage of trial reports satisfying each item of the PEDro scale. The majority of trials use random allocation (97%), report between group comparisons (94%), and report mean and variability data (92%). Few trials blind the subjects (6%) or therapists (1%), use concealed allocation (30%), and use intention to treat analysis (29%). Note that this graph is based on coding for 49,143 records with complete data (977 reports are in-process, so have not been rated using the PEDro scale yet).
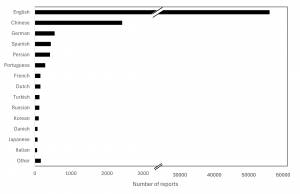
There is no language restriction for indexing reports of trials, reviews and guidelines on PEDro. The graph below illustrates the number of records by language of publication. Reports were published in a total of 31 different languages. English was the most prevalent language of publication (92.3% of reports), followed by Chinese (3.6%), German (0.8%) and Spanish (0.7%).
PEDro produces resources to support physiotherapists keep up to date with the latest evidence, and to translate evidence to practice.
- The ‘Evidence in your inbox’ service with the latest evidence for each subdiscipline and topic has 22,803 subscribers.
- The PEDro monthly newsletter in English and Portuguese languages has 21,384 subscribers.
- PEDro hosts a training program in English and Portuguese languages for learning to use the PEDro scale. There are 569 people around the world who have obtained PEDro certification for using the PEDro Scale.
- PEDro social media is available in English and Portuguese languages and spans across X, Facebook, Instagram and LinkedIn with 62,205 subscribers.
- PEDro has produced 17 World-Wide Journal Clubs that include evidence summaries and expert panel discussions on topics across subdisciplines.
- The PEDro YouTube channel hosts 229 YouTube videos, with 442,362 views and 3,841 subscribers.
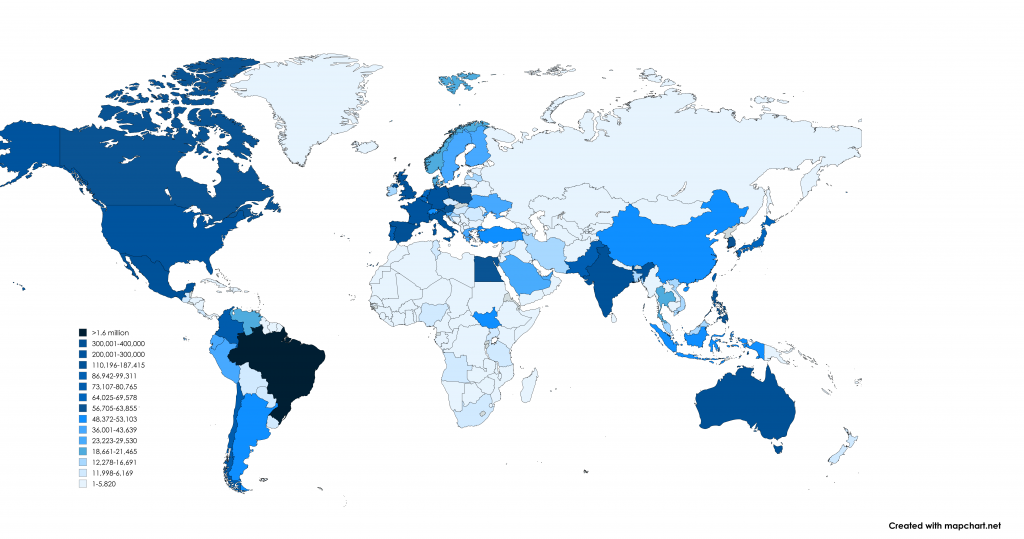
During 2025, PEDro recorded 5,036,286 engagements from 240 countries, regions and territories. This means that a new click, scroll, search, view of videos was initiated every 5 seconds, on average, during 2025. The five countries with the highest usage were:
-
-
- 27% Brazil
- 6% United States of America
- 6% Spain
- 5% Australia
- 5% Germany
-
A heat map of the PEDro searches performed during 2025 is illustrated below.